¶ Multiple Thermal Cases
The Multiple Temperature Profiles tab allows the user to plot and compare the temperature profiles from multiple thermal operations. Click on the Show/Hide Data button to open a window where the user can select the thermal operations and the tubulars or annuli for which she wants to compare the temperature profiles.
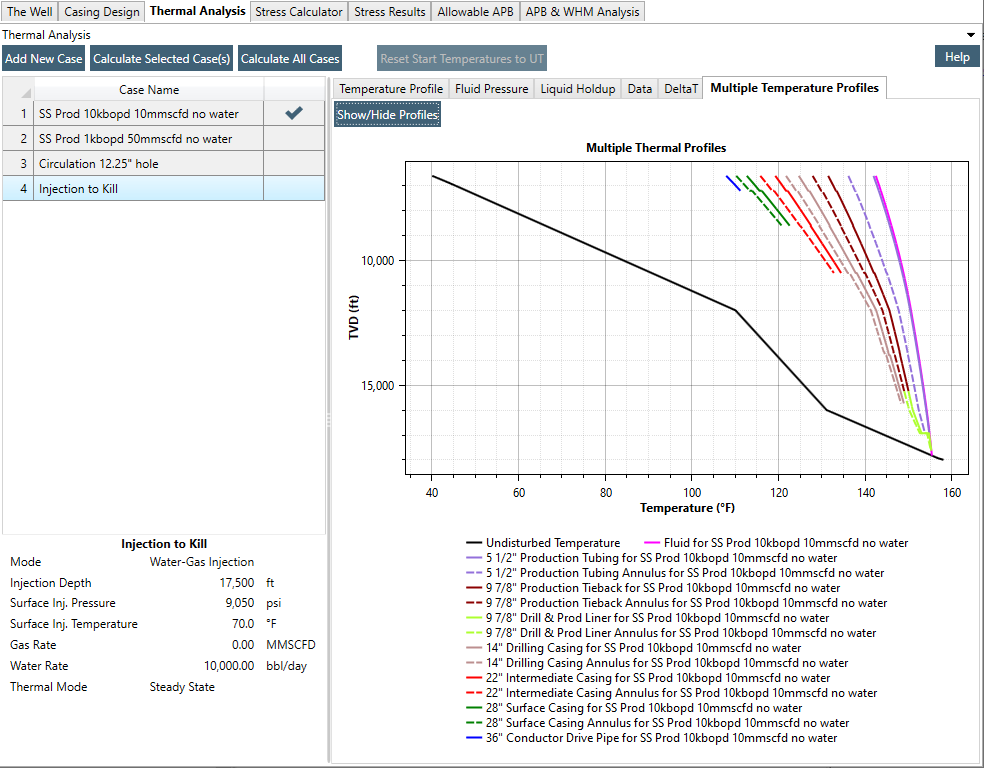
User may select multiple thermal operations and compare the temperature profile for any well tubular or annuli for the selected thermal operations.
User may also plot and compare the fluid pressure profiles for various thermal operations using this feature.
The View Data Grid button opens a window with the temperature or pressure data of the selected thermal operations being compared. The user can right click on the top left corner of this table and select copy to copy all the data displayed in this table. The copied data can be pasted in a Microsoft Excel sheet and be used to analyze it at a later time.
By default, the temperature and pressure data on the plot is shown vs. measured depth. To plot the temperature profile vs. TVD user may right click anywhere on the plot and select Show TVD.
User can also click on the "Copy Image" option to paste the plot in a report or save it as an image using software such as Microsoft Paint.
The results from the thermal processor namely the temperature profiles for various tubulars can be used in the Stress Calculator while defining load cases for well tubulars. This is demonstrated in the next section.
¶ Right-Click Options
- Show MD: Plots the results against MD depths.
- Show TVD: Plots the results against TVD depths.
- Header: Allows user to input text for chart header, perhaps for including the chart in a report.
- Legend: Allows the user to specify where and with what layout the legend will appear.
- Notes: Allows the user to add a block of text that will appear on the chart, useful for including the chart in a report.
- Copy Image: Copies the current plot to the clipboard, for pasting in some other location.
- View Data: The "View Data" option lets the user extract the data from the chart. Note that in the thermal profile, there are two series of baseline temperature data: the Geothermal series contains the interpolated geothermal temperatures at each calculated depth in the thermal case, whereas the Undisturbed Temperature series contains the data points as defined in the Well Characteristics Temperature Profile. The latter series could have significantly more or fewer points than the former.
- Reset Zoom: Zooming in on the chart can be done with the mouse scroll wheel. This command restores the image to the default view.
- X-Axis, Y-Axis: Here, the range and step size of the axis marks can be set or reset.
- Font Settings: Provides a means to change the font of the chart text.
- Series Color: Provides a means to change the color of any single series on the chart.