¶ Fluid Pressure
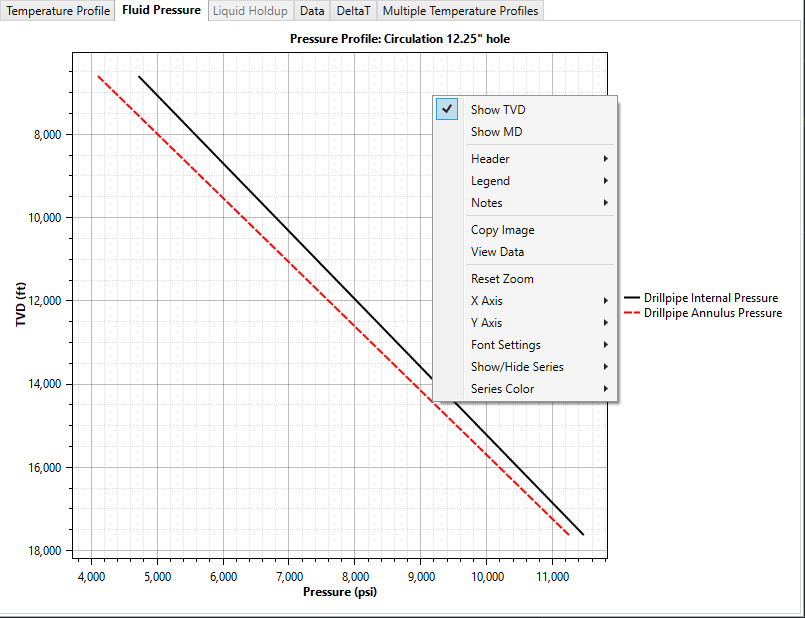
The Fluid Pressure chart plots the pressure profile for the produced or injected fluid, as well as the bubble point pressure plot for comparison.
¶ Right Click Options
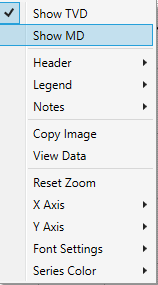
Right-Click menu options explained:
- Show MD: Plots the results against MD depths.
- Show TVD: Plots the results against TVD depths.
- Header: Allows user to input text for chart header, perhaps for including the chart in a report.
- Legend: Allows the user to specify where and with what layout the legend will appear.
- Notes: Allows the user to add a block of text that will appear on the chart, useful for including the chart in a report.
- Copy Image: Copies the current plot to the clipboard, for pasting in some other location.
- View Data: The "View Data" option lets the user extract the data from the chart. Note that in the thermal profile, there are two series of baseline temperature data: the Geothermal series contains the interpolated geothermal temperatures at each calculated depth in the thermal case, whereas the Undisturbed Temperature series contains the data points as defined in the Well Characteristics Temperature Profile. The latter series could have significantly more or fewer points than the former.
- Reset Zoom: Zooming in on the chart can be done with the mouse scroll wheel. This command restores the image to the default view.
- X-Axis, Y-Axis: Here, the range and step size of the axis marks can be set or reset.
- Font Settings: Provides a means to change the font of the chart text.
- Series Color: Provides a means to change the color of any single series on the chart.