Temperature
As the user inputs temperature data into the table, the plot automatically updates, giving immediate feedback.
¶ Data Input
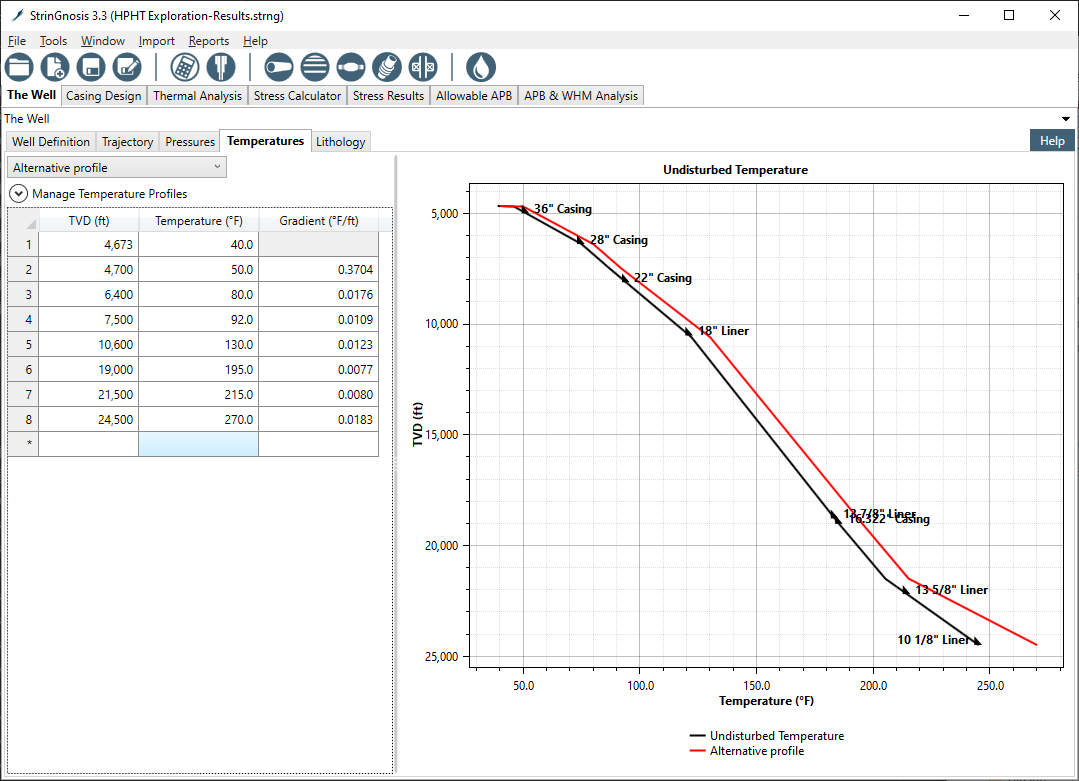
Temperature data can be entered manually, by direct import or by copy and pasting. The columns in the temperature tab includes TVD, Temperature and Gradient. Section Import Undisturbed Temperature describes how to import data or populate undisturbed temperature into the table. See temperature profile which shows two undisturbed temperature profiles, one of which is the default undisturbed temperature for an example well.
¶ Multiple Temperature Profiles
The user can define multiple temperature profiles and display them on the formation temperature chart via the right-click menu’s Show/Hide Series command. Only one profile is used in the calculations at a time; it is selected under the Manage Temperature Profiles menu by ticking the Default button next to the desired profile.
¶ Right Click Menus
Various options are available when Right-Click on the data tables and the charts. They are discussed in sections Working with Tables and Working with Charts.