¶ Design Envelope Tab
The Design Envelope tab displays a VME Ellipse for the currently selected string section. The default view is by RAF (Real Axial Force). This display is the more conventional display and the way that VME stress has been plotted historically. The well designer also has the option to select the EAF (Effective Axial Force) view. The EAF display offers a more advanced look at the VME stresses and the design limits.
In either view mode, double-clicking on any of the load plots brings up a window showing detailed calculation information for that load.
The toggle buttons to switch between RAF and EAF display views, as well as numerous other options for this chart, are found on the slide-out panel on the left side of the window. Click the arrow next to "Expand Options" to see them.
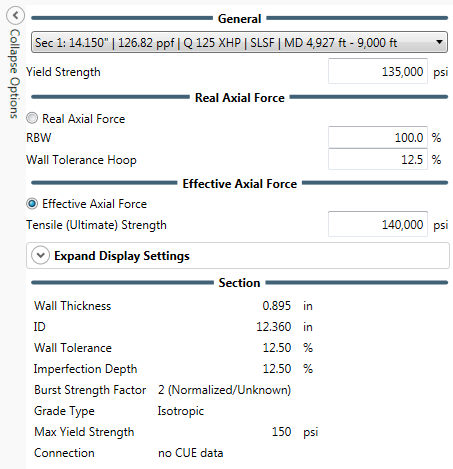
Changes made in the values for Yield Strength, Remaining Body Wall (RBW), Wall Tolerance (Hoop), or Tensile Strength are made strictly locally to this tab. They affect only the plots of the Design Envelope(s), and do not affect any stress calculations.
The Display Options dropdown opens a window that allows the well designer to manipulate how the VME plot is displayed and to select other curves and envelopes to be displayed along with it.
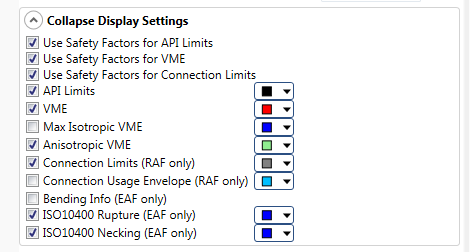
Not all of these options are available in all configurations. For instance,
- Anisoptropic VME plots the anisotropic ellipse. Only available on string sections using anisotropic grades
- Max Isotropic VME plots the maximum VME ellipse. Only available on string sections using grades which specify a max yield strength
- Connection Limits: only applies to string sections with connections having Connection Usage Envelope data
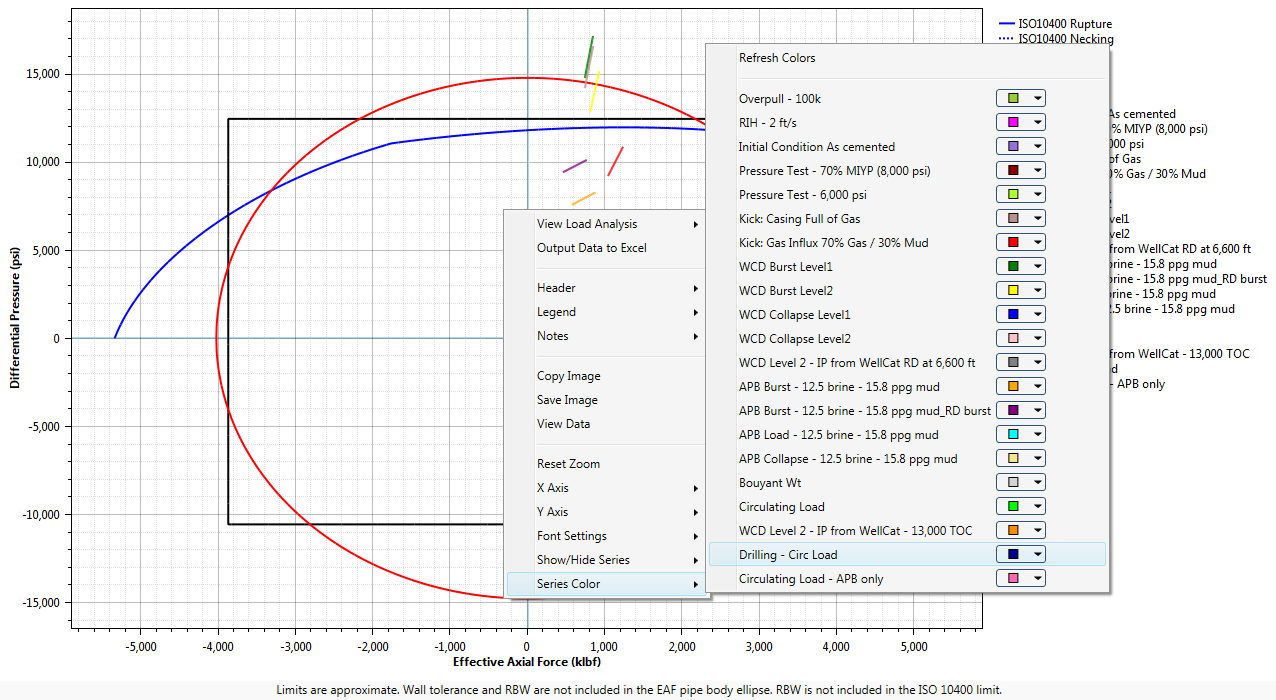
To select the color of the individual load lines, right-click on the VME chart and select Series Color, as shown. You can either choose custom colors for each load, or regenerate all colors for the chart (Refresh Colors).
¶ Real Axial Force (RAF) vs. Differential Pressure
This is the historic, and more conventional, presentation of VME stress data. In this presentation, the well designer has the ability to investigate the impact of casing wear by manipulating the Remaining Body Wall (RBW) value and the impact of different inspection criteria by manipulating the Wall Tolerance value.
¶ Effective Axial Force (EAF) vs. Differential Pressure
This is the presentation of VME stress data best suited for reliability-based designs. The horizontal axis is Effective Force, a significant deviation from the more conventional RAF plot. This presentation will vary depending on the design level selected. For design levels that use a limit state for internal pressure (Level 3, 4 and 5), the ISO-10400 Ductile Rupture Limit State is used and displayed as the half-curve on the upper (burst) half of the VME Plot. The variables used in the Klever-Stewart Rupture Limit calculation are:
- Nominal OD
- Nominal Wall
- Minimum Tensile (Ultimate) Strength
- API Wall Reduction Factor
- Flaw Depth (maximum depth escaping detection)
- Burst Strength Factor (based on the metallic crystalline structure)
- Non-Elastic Correction (Strain Hardening) Factor
In addition, there is one more option available on this chart, via right-click:
- Output Data to Excel™
Selecting Output Data to Excel™ lets you specify a location for a tabular data file containing the plot values for all loads on the display, plus the plot points for the pipe body ellipse and the axes.
ANSI/API TECHNICAL REPORT 5C3 FIRST EDITION, DECEMBER 2008 or ISO 10400:2007 (Identical), Petroleum, petrochemical and natural gas industries – Equations and calculations for the properties of casing, tubing, drill pipe and line pipe used as casing or tubing